Teaching Practice
Basa Basi Mitsy: Teaching Probability with Trading Card Booster Packs
A two-lesson maths plan that uses trading card booster packs to teach probability, expected value and the "collector's problem", with an invented rarity table, a simulation task and a money-wise discussion.
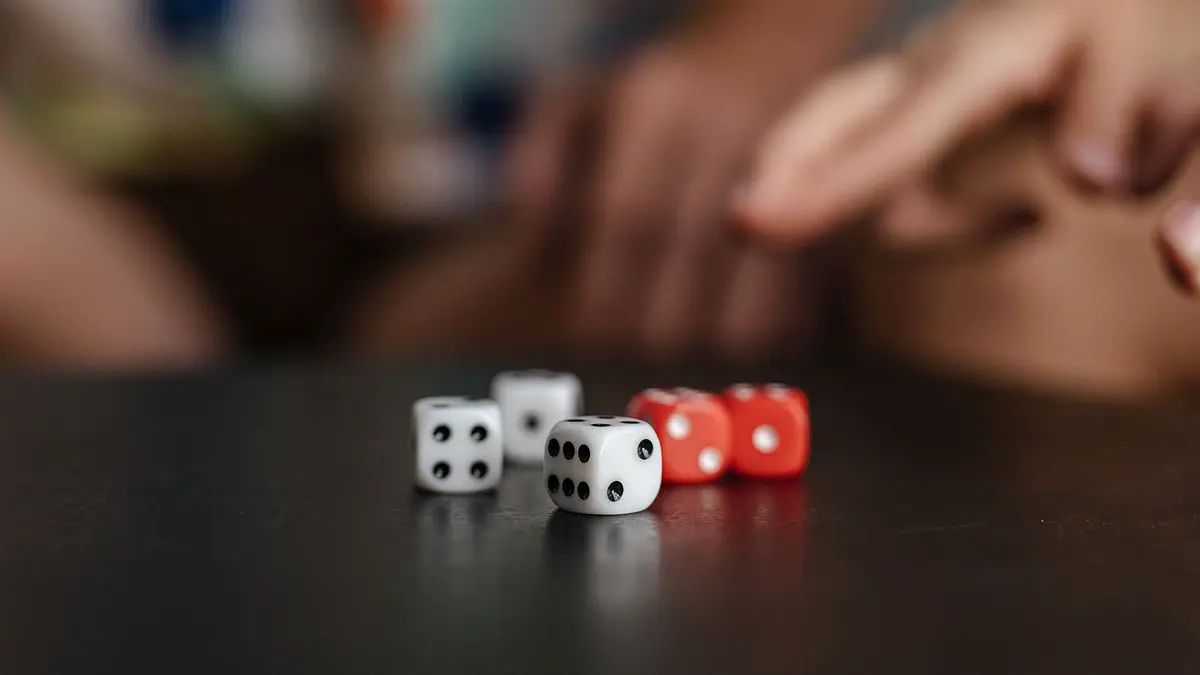
Every year I meet a few students who cannot tell me what a probability of 1 in 20 means, but who can tell me exactly how rare the card they pulled last weekend is. That gap is a gift. Trading card games such as Pokémon TCG and One Piece Card Game are, at heart, probability machines, and many students already care about the outcome.
This is a two-lesson plan I use with Year 8 to Year 11. It needs dice or a spreadsheet, a printed table, and no cards at all — although a few on the desk do wonders for attention.
Lesson 1: What is in a pack?
Warm-up (10 minutes)
Ask: “If you open one pack, what are your chances of getting the rarest card?” Collect guesses on the board. Most students will be optimistic. Keep the guesses; we return to them at the end.
The rarity table (10 minutes)
Give students this table. Make it clear the numbers are invented for the lesson. Real products have their own rates, and publishers do not always publish them.
| Slot type | Chance per pack (invented) |
|---|---|
| Common only | 60% |
| Uncommon or better | 30% |
| Rare | 9% |
| Ultra rare | 1% |
Questions:
- What is the probability of not getting an ultra rare in one pack? (0.99)
- In three packs? (0.99³ ≈ 0.970)
- How many packs until you have a better than even chance of at least one ultra rare? Students solve 1 − 0.99ⁿ > 0.5. (n = 69)
The answer to question 3 is always the moment the room goes quiet.
Simulation (20 minutes)
Pairs simulate 30 packs each. With a d100 (or two d10s), 01–60 is common, 61–90 uncommon, 91–99 rare, 00 ultra rare. With a spreadsheet, =RANDBETWEEN(1,100) does the same.
Pool the class results on the board and compare the observed frequencies with the table. Discuss why small samples wander and large samples settle — the law of large numbers, discovered by the students rather than announced by me.
Lesson 2: What does it cost?
Expected value (15 minutes)
Give an invented price for a pack and an invented price for the ultra rare card bought on its own as a single. Students work out the expected number of packs to get one ultra rare (1 / 0.01 = 100) and the expected cost. Then compare with simply buying the single.
The lesson lands without any lecturing from me: chasing one specific card through random packs is almost always the expensive route. Collectors know this; most beginners do not.
The collector’s problem (15 minutes)
Now ask: “The set has 10 different rare cards, all equally likely whenever a rare appears. How many rares until you have all 10?”
This is the coupon collector problem. The expected number is 10 × (1 + 1/2 + 1/3 + … + 1/10) ≈ 29.3. Get students to calculate how long each next new card takes: the first is instant, the last needs on average 10 rares by itself. That shape — fast at the start, painfully slow at the end — explains a lot of real-world behaviour, from sticker albums to loot boxes.
Discussion (10 minutes)
- Why do packs feel like good value when you open them, and what do the numbers say?
- What would you tell a younger sibling who wants to spend their pocket money on packs?
- Where else do you see random rewards with hidden rates?
Making it real
Before the lesson, I visit a local game shop and note real prices for a booster pack, a starter deck and a few single cards so the invented numbers can be swapped for real ones in the extension task. In Batam, 4PLAY , a trading card and collectibles shop in the basement of Batam City Square mall, lists Pokémon TCG and One Piece Card Game products, single cards with their condition stated, and accessories on its online shop, which makes it easy to build a realistic price sheet without leaving the classroom. Students then redo the expected-value task with real prices — and still find buying the single wins.
Assessment
- Core: correct use of the complement rule (1 − p)ⁿ.
- Secondary: a short written answer comparing simulation results with the table, using the words “sample size”.
- Extension: the full expected cost comparison with real prices, and a two-sentence recommendation to a younger buyer.
Teacher notes
- Keep the tone neutral. Some students love the hobby; the aim is understanding, not judgement.
- The invented table matters. Do not present a guess about a real product’s rates as fact.
- If time is short, run Lesson 2 alone with pre-made simulation results.
Probability is easier to teach when the outcome is something students already want. A booster pack turns out to be one of the cleanest real-world examples I have found.
Pertanyaan yang sering diajukan
Do students need to own cards?
What age group is this for?
Is this encouraging gambling?
294 free online tools that run on your phone
PDF, images, calculators, invoices, domain checks. No sign-up, no watermark, files stay on your device.
- 294 tools
- No sign-up
- No uploads